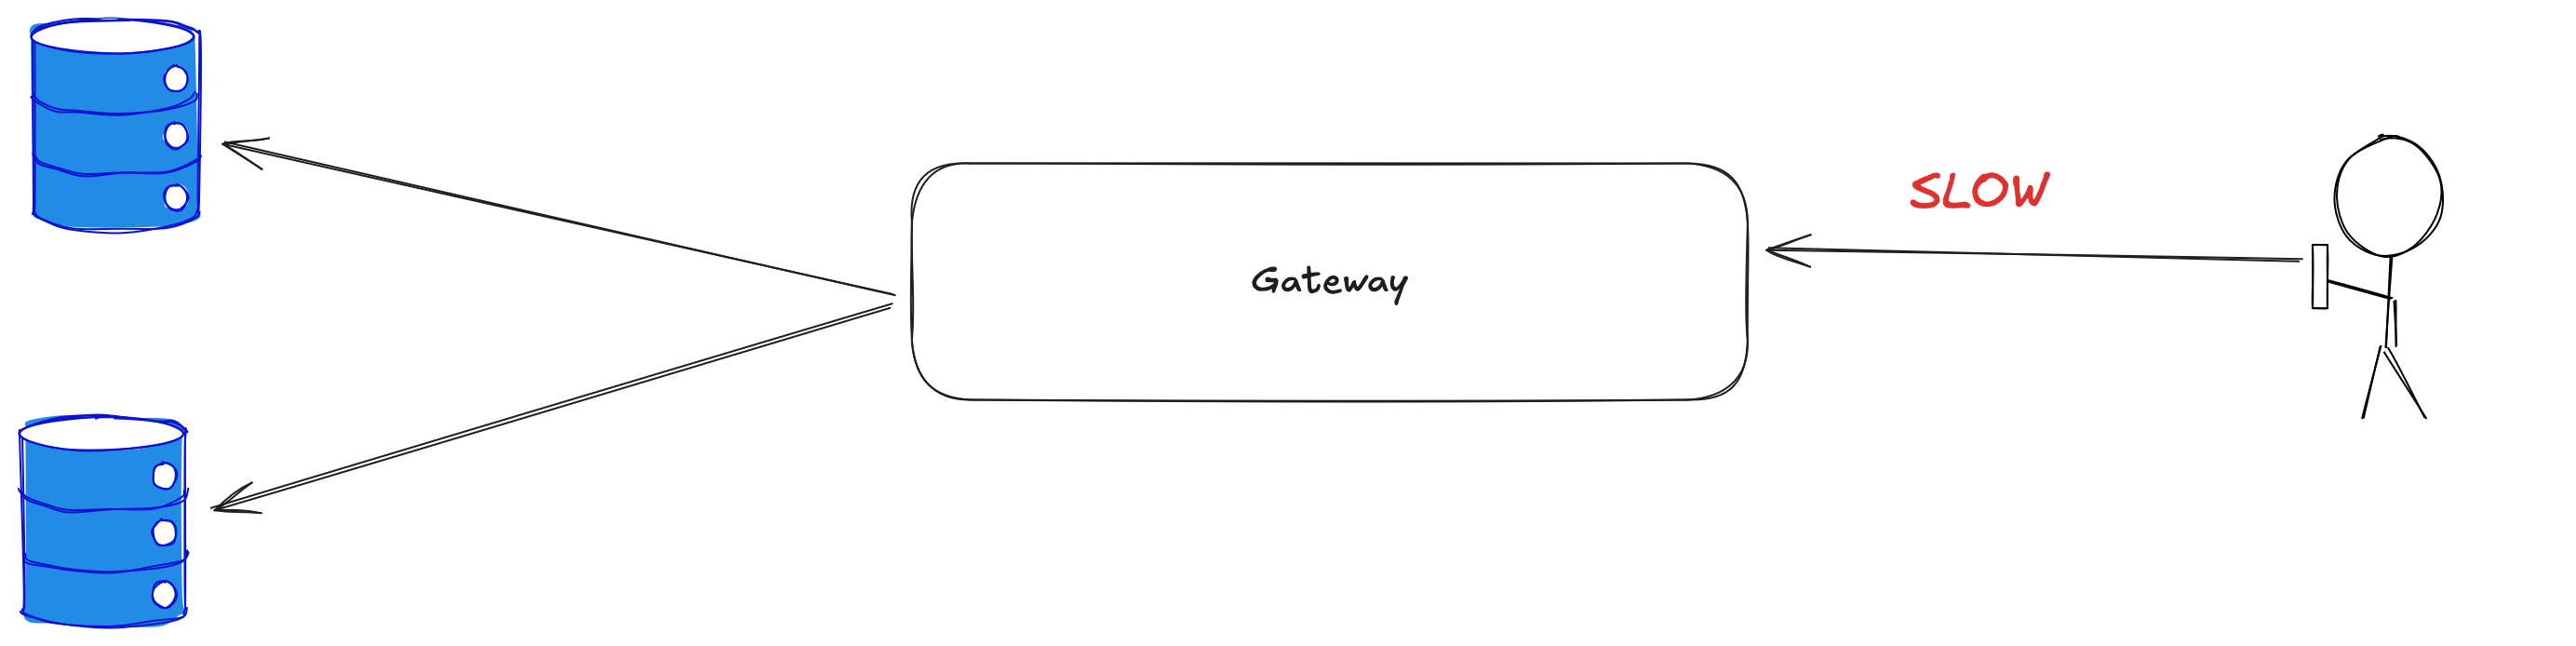
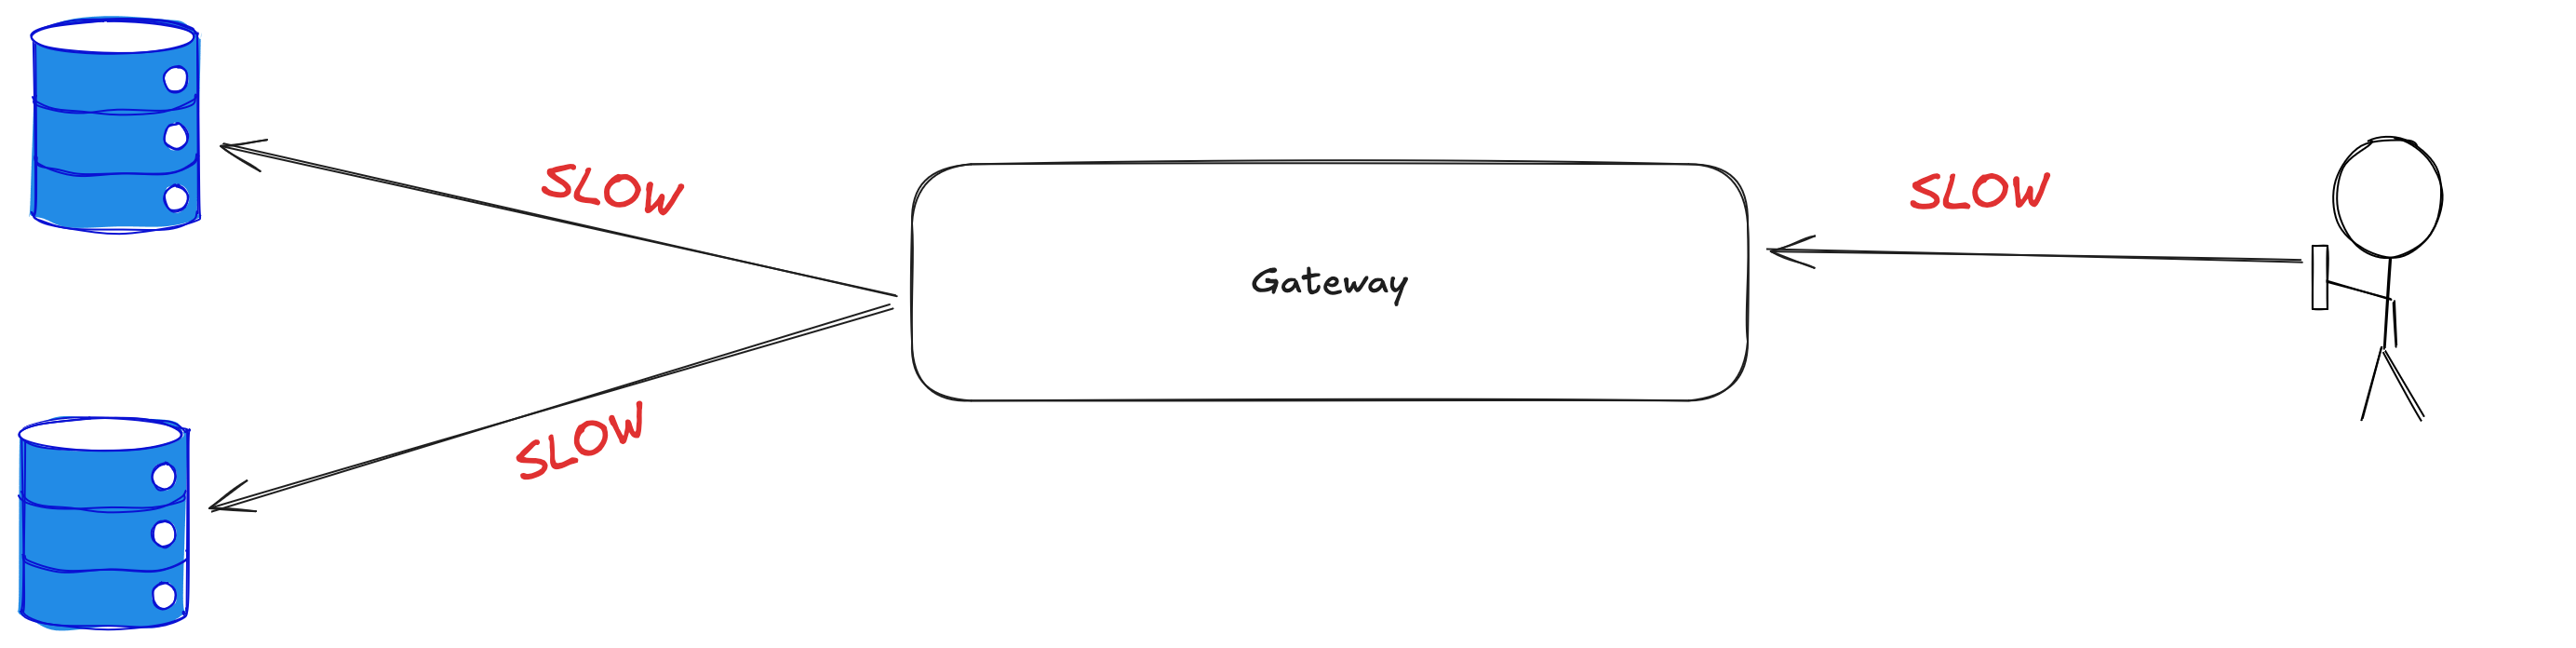
The problem
Why does it take longer to talk to my backend service when my frontend service is being called by slow clients?
| Expected | Observed |
|---|---|
 |  |
This was the problem that was handed to me. It had vexed us for some time, and we had mostly worked around it, or improved our clients, or ignored it. But it was time to figure it out and make it a thing of the past. So in I dove.
Through some experimentation I found a more concrete, measurable, repeatable formulation of what I figured was the same problem:
Why is my service latency P50 twice as high at 10,000 requests per second as it is at 100,000?
It's a much easier thing to reason about, and I think it's the same root cause.
- At 10khz my p50 latency is
330µs. - At 100khz my p50 latency is
160µs.
It's the opposite of what you expect - a loaded machine at p50 should outperform a heavily loaded machine at p50. Or at least they should be similar.
Frontend API CPU time costs 10's of microseconds. Backend API CPU time costs 10's of microseconds. Network time for the small 1kb requests is 10's to 110µs. All in, I expect around 50-180µs p50 at 10khz or 100khz.
You might think at this point that I'm daft squabbling over a couple tenths of a millisecond, but it gets magnified depending on instance type, load, and client quality. This was a way to fix that problem with less noise.
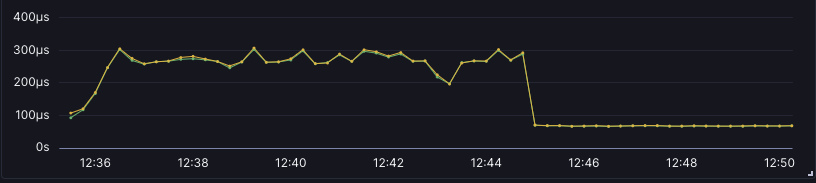
This is how I turned 330µs p50 @ 10khz into 68µs p50 @ 10khz in a Tokio server.
Some context
There's a lot to think about here, and it's basically all both parallel and concurrent. So be patient with yourself and take your time.
Tokio multi-threaded runtimes have an event loop and task queue for each thread. They also have a global task queue, a handle to every other task queue for work stealing, and a global event Driver. Keep these three things in mind.
Normally when you have a networked Tokio service with lots of connections, you play with the event_interval and max_io_events_per_tick tokio settings. My team did that too. The services use a low event_interval (7) and a relatively high io event cap (1024). These were experimentally found to be the best settings for our services. But then we made our services much faster...
The Core
A thread's context in Tokio has a Core. A Core runs forever until it is shut down. The Core is what drives your Futures (async functions). Don't @ me, Context and Core aren't really far enough apart to try to explain the difference in this post so I'm just going to pretend they're more or less the same thing.
A Core has a local tick counter of how many times it has spun. Usually that is about the number of polls the Core has done. It can count up quickly, but hold on; I'm about to make it count up quickly. In case you don't remember, the distance between any 2 awaits is 1 poll() (more or less, this is a fine mental model for now). Each time a Core spins, it ticks up the counter by 1, wrapping.
I'm not parking officer, my foot is just on the brake...
The Core checks its tick count every tick, and if it is at the right tick, it does its maintenance(). The thread's maintenance first does a "park with 0 timeout" which internally means "poll MIO but do not block." You can configure how often each Core checks for events (runs epoll) by adjusting the event_interval. In here MIO is asked briefly for what it has ready, and it gives those ready events to the Core that is currently doing the Driver maintenance.
There's a clever observation here that Tokio uses: A bunch of threads might be in this runtime, and they might all try to process the IO Driver at the same time. They solved that elegantly by letting them race. Now that relies on work stealing and global task submission to spread out work. But I really like this race, and I'm going to exploit it soon.
...and the gas
Let's say you're a thread, one of many. It's your time to look at the Driver, and you win the race. Hooray! More work for you. Okay, so what's next? IO is enabled, you jump through a bunch of plumbing stack frames and eventually arrive at the crown jewel of Rust IO: MIO. You epoll up a list of events and then iterate them all. There are 2 problems here:
- What if there are 10,000 events?
- What if each event has 100 listeners?
You have to walk through every event, and you have to signal every listener. That means you are wakeing 1,000,000 tasks in a single poll in this example. That's not cooperative at all! Leave some work for somebody else why don't you?
Do (much) less, (much) more often
The same refrain comes up again and again for my whole career with different words:
- Checkpoints are taking too long, let's schedule them for once a week.
- Auto vacuum is taking too much cpu and disk, so let's raise the trigger limits.
- Garbage collection is taking too long, so give the process more memory.
- There are too many tasks to
wake, so let's lock them in a loop and wake them anyway (looking at you, TokioWakeList)
There's a justifiable instinct to batch for more efficiency. But many systems do not benefit from large batches. Cooperative multitasking systems, like Tokio, require cooperation in the form of very small units of work. Not huge batches.
When a thread monopolizes your IO driver for a long time waking a bunch of tasks, you accumulate more bytes in your NIC's receive buffers.
When you wake a ton of tasks and take them into your own work queue, you do imbalanced work. You're relying on your peers to notice and give you a break by stealing stuff from your to-do list.
How to do low-latency IO with Tokio
You need to consider all of the thoughts here together. In isolation they are bad. It's only when you consider all of it that the rationale is clear. It's goofy, but come along for the ride.
max_io_events_per_tick = 4
What if you just took a little bit of work from the network? A reasonable amount you can probably manage yourself? A cooperative amount of work?
Set max_io_events_per_tick to 4.
But now I can't process network events fast enough!!! Stay tuned. Remember, this is a little counterintuitive and you need to take it all in.
event_interval = $thread_count or higher
Okay so you might be tempted to set event interval to something very small, like 1 or 2. That kind of does some things that are okay, but it does not help with your work balance and it causes increasing lock contention in maintenance() as thread count increases. Seriously at 12 threads it's a problem.
Leave it at the default 61 or bring it down toward your $thread_count.
But I still can't process network events fast enough!!! I know, but it makes more sense to explain it in this order.
Use burn tasks
This is evil. Just leave this page if you value your soul. Otherwise...
for _ in 0..thread_count {
    // burn tasks
    tokio::spawn(async {
        loop {
            yield_now().await;
        }
    });
}
Evil. But, importantly, cooperative. Please take a moment to remember the previous 2 things at the same time as you read and consider this code.
Since you are only taking 4 IO events per poll of the IO Driver, you need to service it much more frequently. By keeping all the runtime threads spinning, you continually service the Driver from various threads.
Burn tasks keep each runtime thread making roughly constant progress on tick() to race for the IO Driver try-lock. Each runtime thread will go into the Driver very often, and with only up to 4 events to handle at a time, each runtime thread will very quickly exit the Driver's critical section. This achieves network load balancing naturally, without relying on event submission queues or work stealing.
It also keeps each runtime thread out of parked state. On the Graviton servers I generally use, it takes roughly 100-200µs to decide to park, then notify, then wake, and finally resume a thread. If you have a moderately high, consistent rate of work, you'll be parking a lot right when there's new work for you to do. That latency isn't great for your p100.
Results
We dropped from 320µs to 68µs p50 at 10khz. I also managed 1.6ms p100 at 260khz. The system also no longer has that shocking property with 100khz halving our p50 latency. As load increases past 10khz, latency slowly increases as you'd simply expect. The machine is working like a machine.
It's not without consequence though. The evil tasks pin the runtime threads at 100% at all times. Due to that, it's not appropriate in the general case. But the lessons learned from this experiment will feed into future improvements.